Volume within the bar
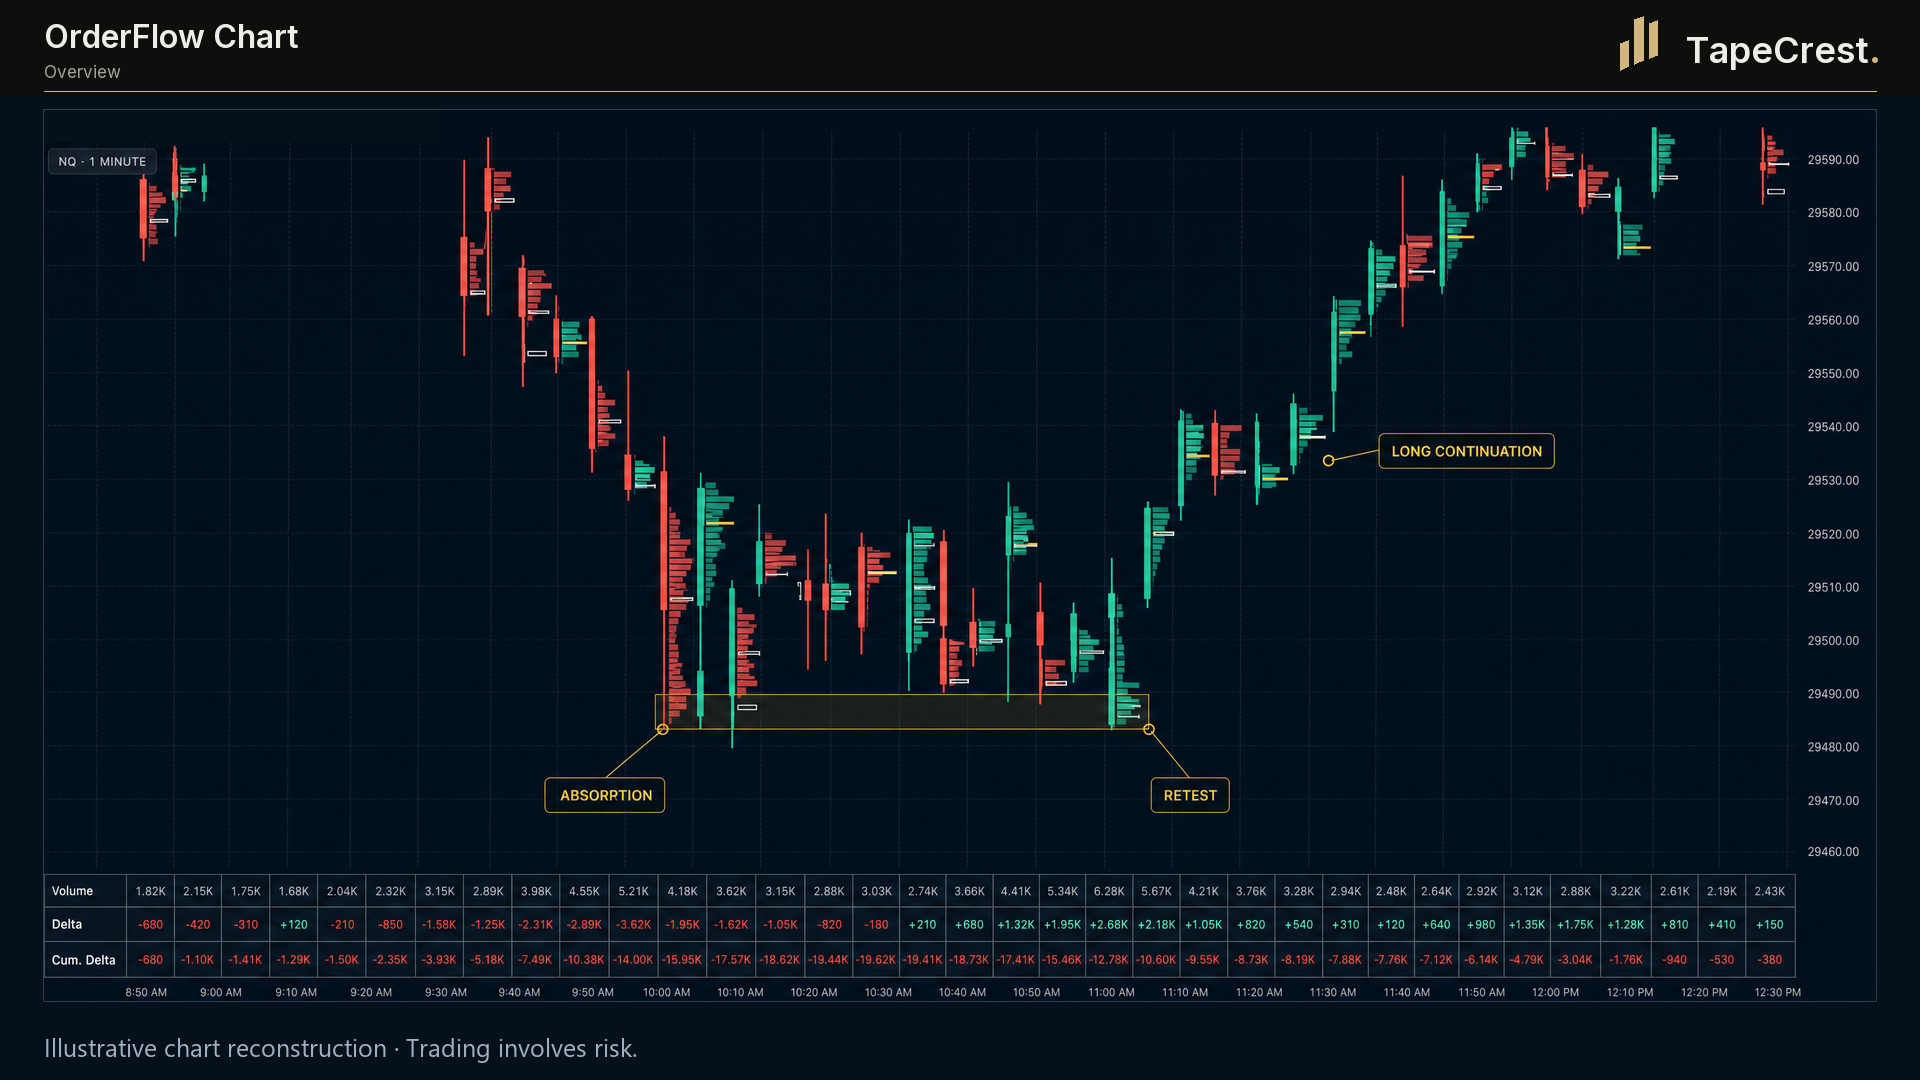
See where traded volume concentrates within each candle, with per-bar point of control and value-area references.
Order flow / NinjaTrader 8
Volume at price. Delta. Imbalance. Bring the activity behind a price bar into a chart you can study.
7-day trials at launch.No card required. No automatic charges. Join the launch list to hear when access opens.
What it adds
A candle gives you its open, high, low and close. An order flow chart adds the volume traded within that range, so you can review activity at individual prices rather than relying on the candle’s shape alone.
OrderFlow Chart brings per-bar volume profiles, delta, point of control, value area and imbalance information onto supported NinjaTrader charts. Adjust the display to the instrument and the question you want to answer.
Inside the tool
See where traded volume concentrates within each candle, with per-bar point of control and value-area references.
Read volume and delta views together. Highlight qualifying imbalances and compare them with price behaviour and the session map.
Review aggregated large-trade markers and volume/delta statistics. Historical coverage depends on your data and configuration.
A practical workflow
Use a session level or a price area you already watch. Open the same instrument in a supported chart type.
Look at the distribution of volume, the change in delta and the location of qualifying imbalances around that reference.
Compare the observation with the wider session and your own criteria. Add Absorption Levels when persistent price references would help your review.
Before you start
Product questions
It can work on the supported chart types listed above. A Volumetric chart is read directly; other supported types use an additional matching volumetric series.
A footprint is one way of displaying order flow within a bar. The wider practice also uses session context, delta, profiles and price behaviour. This product focuses on information you can inspect on the chart.
Absorption Levels adds horizontal references from qualifying bid/ask activity. Key Levels supplies the wider session map. Start with the combination that answers a specific question in your process.
At launch, each paid TapeCrest indicator or add-on will offer a seven-day trial, with no card required and no automatic charge. Public trial access is not open yet. Explore the tools and check their platform and data requirements here.
When trials open, your seven days will begin at the first successful activation of that product. Browsing, account creation and downloading will not start it. Reinstalling will not restart it.
Trial access expires. You choose whether to purchase the product; there is no automatic conversion or charge. Platform, market-data and external AI-model costs are separate from the TapeCrest trial.
Opening Range Breakout (ORB) is planned as a benefit included without extra cost in a qualifying package. Package details will be confirmed before launch. That benefit is separate from the seven-day trial policy for paid products.
Continue your workflow
Coming to TapeCrest
At launch, each paid indicator or add-on will offer seven days to explore it in your own setup. Find your tool, check the requirements and prepare a workflow that fits the way you work.
7-day trials at launch.No card required. No automatic charges. Join the launch list to hear when access opens.
Explore paid indicators and add-ons. Check platform, data and product requirements first.
Your seven days will begin with the product’s first successful activation. Reinstalling will not reset the clock.
Access expires after the trial. Continue only with a purchase you choose; no automatic charge follows.
Be there from the beginning
Join the launch list for TapeCrest indicators and add-ons. Get an email when your next trading tool is ready to explore.
Seven days to make it your own.
7-day trials at launch. No card required.
No automatic charges.
Still choosing? Tell us what you want to improve. We can help you find a starting point.
Built for NinjaTrader 8